This tutorial looks at all the ways we can configure map panning and zooming.
Panning
The map chart has two options related to panning it: panX and panY.
panX controls what happens when map is dragged horizontally, and panY is responsible for vertical drag behavior.
There are three options for both:
| Value | Comment |
|---|---|
"none" | Do nothing. Map will remain static when dragged in the specific direction. |
"rotateX" or "rotateY" | Will "rotate" the map, wrapping around contents like a globe would be rotated. |
"translateX" or "translateY" (default) | Move contents of the map without changing appearance. |
Zooming
Zooming in and out the chart can be done in a variety of ways, e.g. with mouse wheel or pinch gestures, via API and some interactions on the map, or via zoom control.
Zoom steps
Whenever zoom operation kicks in (via API, zoom control, or mouse wheel spin) the map changes its zoom level by 2.
We can change map chart's zoomStep setting to a lower value (making zoom in slower) or to a bigger value to make map zoom in deeper with each step.
Limiting zoom
As a default behavior, map chart would not let zoom out beyond level 1 and zoom in beyond level 32.
We can change that using minZoomLevel and maxZoomLevel chart settings respectively.
let chart = root.container.children.push(
  am5map.MapChart.new(root, {
    panX: "rotateX",
    wheelY: "zoom",
    minZoomLevel: 0.5,
    maxZoomLevel: 16
  })
);
var chart = root.container.children.push(
  am5map.MapChart.new(root, {
    panX: "rotateX",
    wheelY: "zoom",
    minZoomLevel: 0.5,
    maxZoomLevel: 16

  })
);
Zooming via API
Map chart provides several methods for us to use to perform zoom operations:
| Method | Comment |
|---|---|
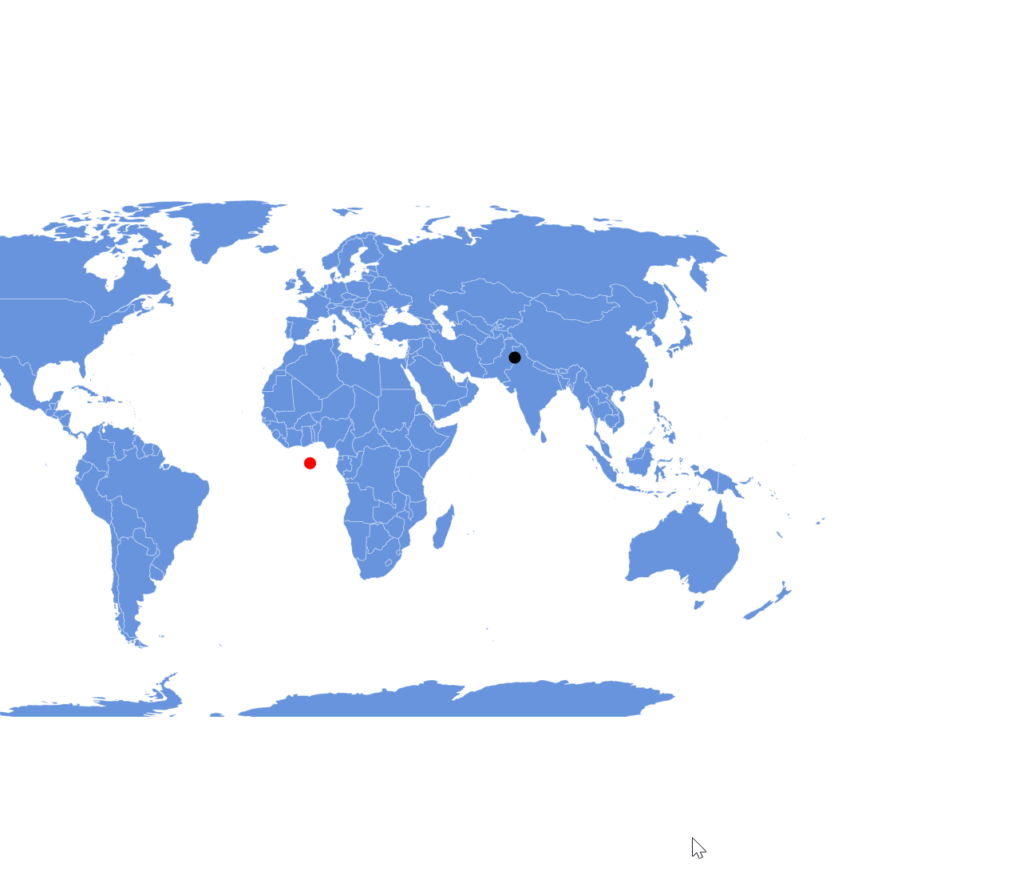
zoomToPoint() | Centers and zooms the map to specific X/Y coordinates in pixels. |
zoomToGeoPoint() | Centers and zooms the map to specific latitude/longitude coordinates and zoom level. |
zoomIn() | Zooms the map in by zoomStep setting value. |
zoomOut() | Zooms the map out by zoomStep setting value. |
The following call will zoom the map to focus on Europe:
chart.zoomToGeoPoint({ longitude: 10, latitude: 52 }, 3.5);
chart.zoomToGeoPoint({ longitude: 10, latitude: 52 }, 3.5);
Zooming to clicked object
We can also add a click event to map polygons to zoom in on them automatically, by using map polygon series' method zoomToDataItem():
polygonSeries.mapPolygons.template.events.on("click", function(ev) {
  polygonSeries.zoomToDataItem(ev.target.dataItem);
});
polygonSeries.mapPolygons.template.events.on("click", function(ev) {
  polygonSeries.zoomToDataItem(ev.target.dataItem);
});
Mouse-wheel behavior
Setting behavior
There are two separate settings for mouse wheel behavior: wheelX (controls what happens when wheel is spinned horizontally) and wheelY (what happens when wheel is spinned vertically).
With the following possible values:
| Value | Comment |
|---|---|
"none" | Do nothing. Map will remain static when dragged in the specific direction. |
"rotateX" | Will "rotate" the map horizontally, wrapping around contents like a globe would be rotated. |
"rotateY" | Will "rotate" the map vertically, wrapping around contents like a globe would be rotated. |
"translateX" | Move contents of the map horizontally without changing appearance. |
"translateY" | Move contents of the map vertically without changing appearance. |
"zoom" | Zoom the map while centering on the actual position of the mouse cursor. |
wheelY is set to "zoom" by default.
let chart = root.container.children.push(
  am5map.MapChart.new(root, {
    panX: "rotateX",
    wheelY: "zoom"
  })
);
var chart = root.container.children.push(
  am5map.MapChart.new(root, {
    panX: "rotateX",
    wheelY: "zoom"
  })
);
Sensitivity
Mouse wheel sensitivity can be adjusted with map chart's wheelSensitivity setting.
With default at 1, the value can be increased or decreased to make chart zoom in faster or slower, respectively.
let chart = root.container.children.push(
  am5map.MapChart.new(root, {
    panX: "rotateX",
    wheelY: "zoom",
    wheelSensitivity: 0.7
  })
);
var chart = root.container.children.push(
  am5map.MapChart.new(root, {
    panX: "rotateX",
    wheelY: "zoom",
    wheelSensitivity: 0.7
  })
);
Control+scroll
Enabling mouse-wheel behavior will make the map zoom but may disrupt scrolling of the whole page when mouse cursor is over the chart.
The common practice is to enable zoomonly when CTRL key is pressed. To implement that we can disable all wheel behavior by default, and only enable it when CTRL key is down:
var chart = root.container.children.push(
  am5map.MapChart.new(root, {
    panX: "rotateX",
    projection: am5map.geoNaturalEarth1(),
    wheelY: "none"
  })
);

chart.events.on("wheel", function(ev) {
  if (ev.originalEvent.ctrlKey) {
    ev.originalEvent.preventDefault();
    chart.set("wheelY", "zoom");
  }
  else {
    chart.set("wheelY", "none");
  }
});
var chart = root.container.children.push(
  am5map.MapChart.new(root, {
    panX: "rotateX",
    projection: am5map.geoNaturalEarth1(),
    wheelY: "none"
  })
);

chart.events.on("wheel", function(ev) {
  if (ev.originalEvent.ctrlKey) {
    ev.originalEvent.preventDefault();
    chart.set("wheelY", "zoom");
  }
  else {
    chart.set("wheelY", "none");
    overlay.show();
    overlay.setTimeout(function() {
      overlay.hide()
    }, 800);
  }
});
See the Pen
amCharts: Zooming map with CTRL key and mouse wheel by amCharts team (@amcharts)
on CodePen.0
We can enhance this behavior with Google-like message over the chart when scroll is used without CTRL key pressed.
// Create curtain + message to show when wheel is used over chart without CTRL
let overlay = root.container.children.push(am5.Container.new(root, {
  width: am5.p100,
  height: am5.p100,
  layer: 100,
  visible: false
}));

let curtain = overlay.children.push(am5.Rectangle.new(root, {
  width: am5.p100,
  height: am5.p100,
  fill: am5.color(0x000000),
  fillOpacity: 0.3
}));

let message = overlay.children.push(am5.Label.new(root, {
  text: "Use CTRL + Scroll to zoom",
  fontSize: 30,
  x: am5.p50,
  y: am5.p50,
  centerX: am5.p50,
  centerY: am5.p50
}));

chart.events.on("wheel", function(ev) {
  // Show overlay when wheel is used over chart
  if (ev.originalEvent.ctrlKey) {
    ev.originalEvent.preventDefault();
    chart.set("wheelY", "zoom");
  }
  else {
    chart.set("wheelY", "none");
    overlay.show();
    overlay.setTimeout(function() {
      overlay.hide()
    }, 800);
  }
});
// Create curtain + message to show when wheel is used over chart without CTRL
var overlay = root.container.children.push(am5.Container.new(root, {
  width: am5.p100,
  height: am5.p100,
  layer: 100,
  visible: false
}));

var curtain = overlay.children.push(am5.Rectangle.new(root, {
  width: am5.p100,
  height: am5.p100,
  fill: am5.color(0x000000),
  fillOpacity: 0.3
}));

var message = overlay.children.push(am5.Label.new(root, {
  text: "Use CTRL + Scroll to zoom",
  fontSize: 30,
  x: am5.p50,
  y: am5.p50,
  centerX: am5.p50,
  centerY: am5.p50
}));

chart.events.on("wheel", function(ev) {
  // Show overlay when wheel is used over chart
  if (ev.originalEvent.ctrlKey) {
    ev.originalEvent.preventDefault();
    chart.set("wheelY", "zoom");
  }
  else {
    chart.set("wheelY", "none");
    overlay.show();
    overlay.setTimeout(function() {
      overlay.hide()
    }, 800);
  }
});
See the Pen
amCharts: Zooming map with CTRL key and mouse wheel by amCharts team (@amcharts)
on CodePen.0
Pinch zoom
The map can be pinch-zoomed/panned on multi-touch devices, like phones, tables and touch-screen-enabled computers.
Should we want to disable it, we can use pinchZoom setting:
let chart = root.container.children.push(
  am5map.MapChart.new(root, {
    panX: "rotateX",
    pinchZoom: false
  })
);
var chart = root.container.children.push(
  am5map.MapChart.new(root, {
    panX: "rotateX",
    pinchZoom: false
  })
);
Panning outside viewport
Chart will restrict how far outside its viewport map can be dragged out.
Basically, map chart would not allow map to be dragged in such way, that it would not cover or at least touch center of the chart container.
We can restrict it even further using chart's setting: maxPanOut.
It accepts numeric values (default: 0.4) that mean relative size to map itself.
E.g. setting maxPanOut to 0.5 will mean that 50% of the map can be outside center of the chart container.
let chart = root.container.children.push(
  am5map.MapChart.new(root, {
    panX: "translateX",
    maxPanOut: 0.5
  })
);
var chart = root.container.children.push(
  am5map.MapChart.new(root, {
    panX: "translateX",
    maxPanOut: 0.5
  })
);
maxPanout: 0.4(default)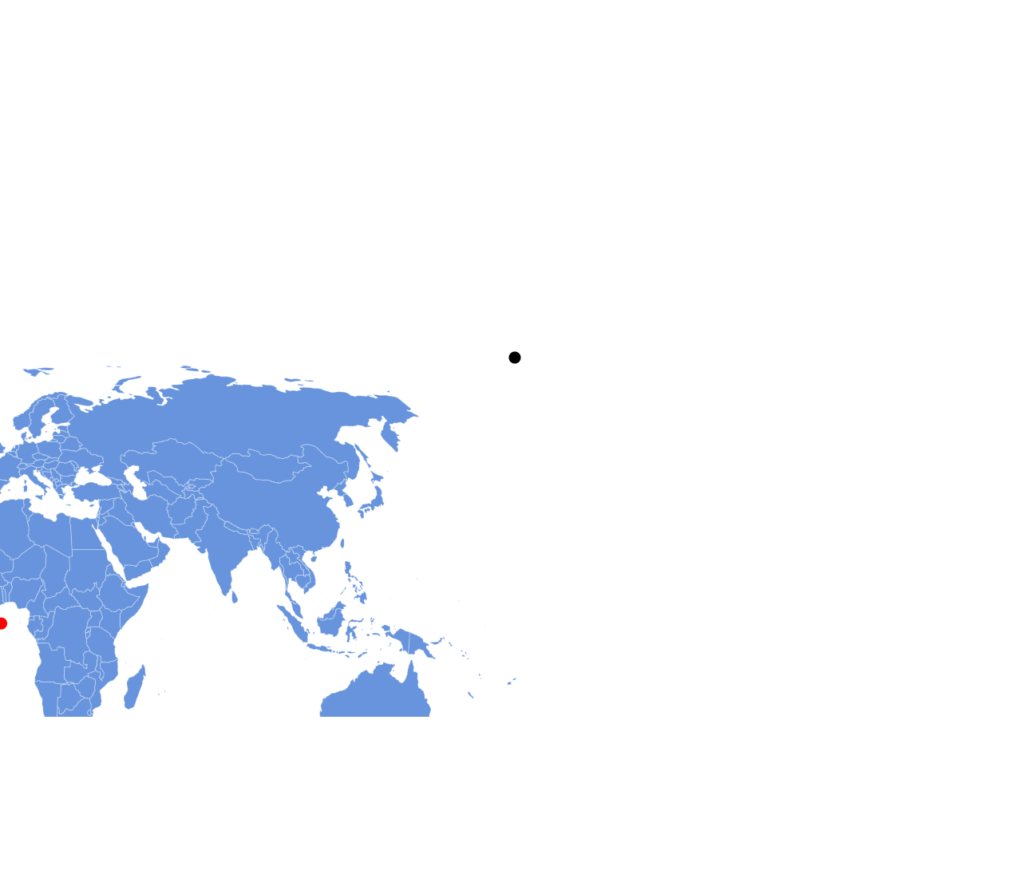
maxPanout: 1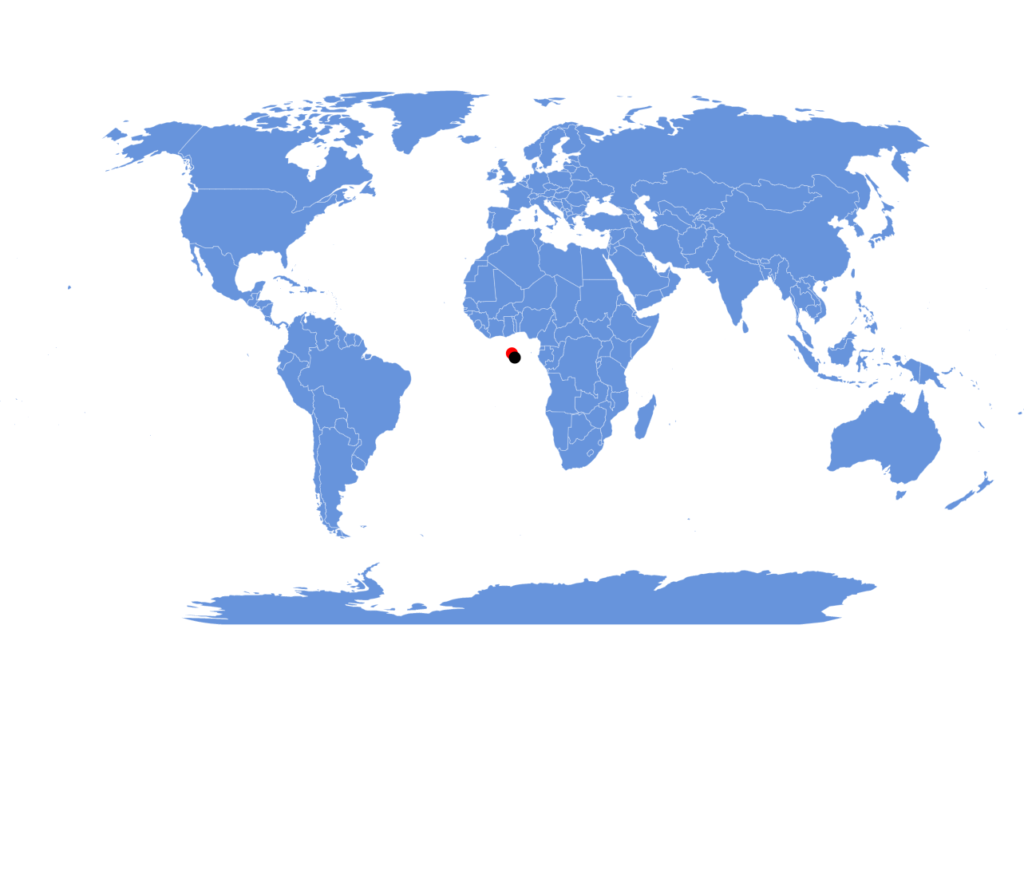
maxPanout: 0


NOTE maxPanOut is not relevant if pan settings are set to rotate the map, rather than move it.
Initial position and zoom
Setting
Map chart has two options for setting its initial/default position and zoom level: homeGeoPoint and homeZoomLevel respectively.
We can use those to set those to center around some latitude/longitude coordinates and zoom in automatically on start.
The following will position and zoom in the map to focus on Europe:
let chart = root.container.children.push(
  am5map.MapChart.new(root, {
    homeZoomLevel: 3.5,
    homeGeoPoint: { longitude: 10, latitude: 52 }
  })
);

// We need at least one PolygonSeries created before map can zoom
// ...

polygonSeries.events.on("datavalidated", function() {
  chart.goHome();
});
var chart = root.container.children.push(
  am5map.MapChart.new(root, {
    homeZoomLevel: 3.5,
    homeGeoPoint: { longitude: 10, latitude: 52 }
  })
);

// We need at least one PolygonSeries created before map can zoom
// ...

polygonSeries.events.on("datavalidated", function() {
  chart.goHome();
});
NOTE Note the goHome() call in the code snippet above. It is required to make the chart respect homeZoomLevel and homeGeoPoint settings on first load. Please also note, that it needs to be called only when MapPolygonSeries has its data loaded, so that map has its bounds.
Resetting position/level
Via API
Map can be reset to its initial position and zoom level by invoking map chart's goHome() method:
chart.goHome();
chart.goHome();
Via background click
We can add click event to the chart's background and invoke goHome() method in it to zoom out the chart when user clicks on background (water):
chart.chartContainer.get("background").events.on("click", function() {
  chart.goHome();
});
chart.chartContainer.get("background").events.on("click", function() {
  chart.goHome();
});
Zoom control
Adding zoom control
Map chart supports built-in control that adds zooming chart via handy buttons.
To add it, simply instantiate a ZoomControl and set it to map chart's zoomControl setting.
chart.set("zoomControl", am5map.ZoomControl.new(root, {}));
chart.set("zoomControl", am5map.ZoomControl.new(root, {}));
Configuring buttons
Zoom control has two properties that hold button instances: minusButton and plusButton.
Both are elements of type Button.